Debugging Udon Projects
Debugging is how you learn about what's going on under the hood in VRChat, your world, and your Udon code. It's a key skill to develop for programming in general, and for building your worlds.
It's important to test your worlds in VRChat before publishing them. Most errors can be fixed in the Unity editor, but you will sometimes find yourself with worlds or Udon programs that can only be debugged in VRChat.
VRChat's Debug Log
To help you find errors and make them easier to understand, VRChat saves information about worlds you visit, errors you encounter, and other behind-the-scenes info. This is called the "output log" or the "debug log."
You can access VRChat's log directly in VRChat or as a text file on your PC.
1. View Logs in VRChat
When you launch VRChat with the Debug GUI enabled (see below), you can turn on special Debug overlays in both Desktop and VR modes. To view your log messages as they occur, press RShift + Backtick1 + 3. You can find all the shortcuts available for different debug overlays on the Keyboard and Mouse page.
2. View Logs in a Text Editor
You can view these files during or after a VRChat session by finding them on your disk and opening them up. They are typically saved to the following folder, with your computer username instead of 'YourName':
C:\Users\YourName\AppData\LocalLow\VRChat\VRChat
In this folder, you'll find some more folders, and a handful of files with names like:
output_log_08-55-48.txt
These are your log files - a new one is made each time you launch VRChat, with a timestamp to keep the names unique. You can open them in any text browser to find detailed information of what happened during your session.
How to enable Udon Debugging
By default, VRChat's log does not contain detailed information about Udon.
When you "Build and Test" your world using the button in the VRChat Control Panel, Unity launches VRChat with additional debugging features enabled. This gives you all the information possible.
In order to copy the way that Build and Test launches VRChat, you need to launch VRChat with additional launch parameters.
There are three ways to configure VRChat's launch parameters, described below.
1. VRC Quick Launcher
The VRC Quick Launcher allows you to choose which debugging features to enable. You can find the VRC Quick Launcher in the "Tools" tab of the Creator Companion.
2. Batch Files
You can use a batch file to launch VRChat with special options. A batch file is a plain text file that contains some special commands. This gives you a convenient shortcut to immediately start VRChat with debugging enabled.
- Make a new text file called
debug.batright next to the VRChat.exe on your machine. - Add this line to the file:
VRChat.exe --no-vr --enable-debug-gui --enable-sdk-log-levels --enable-udon-debug-logging- This command turns on three flags for extra logging, and also forces VRChat to bypass VR for desktop testing.
- There are more options you can pass along - you can include any of the flags from the VRChat Launch Options page as well as the Unity Standalone Player command line arguments.
- For example, the following command launches VRChat on your secondary VRChat profile and forces a screen width of 720 pixels:
VRChat.exe --profile=1 --no-vr --enable-debug-gui --enable-sdk-log-levels --enable-udon-debug-logging -screen-width 1280 -screen-height 720
- Save the batch file and run it.
- (Optional) Right-click the batch file, create a shortcut, and move the shortcut to your desktop.
- Run the batch file by double-clicking it.
3. Steam Launch Options
If you use the Steam version of VRChat, you enable debugging by changing VRChat's launch options.
- In your Steam Library, right-click on the VRChat entry and choose 'Properties'.
- In the 'General' tab, press the 'Set Launch Options' button.
- In the field that appears, you can enter the VRChat-specific flags you want always enabled, like
--enable-debug-gui --enable-udon-debug-loggingto always have the Debug GUI and Udon Debugging enabled.
It is not recommend to always keep debugging enabled. It decreases VRChat's performance and increases the size of your log files. Disable debugging if you don't need it.
How to add Logs to your Udon Program
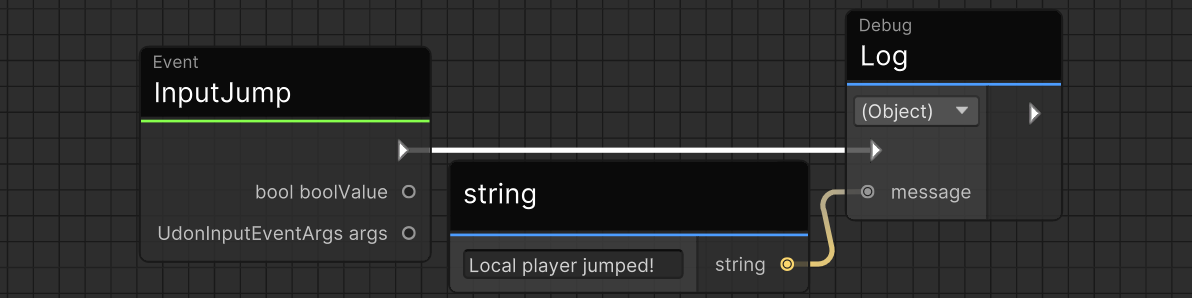
If you're ever in a situation where Udon is not doing something that you want it to do, a good way to diagnose it is to add Debug Log nodes with unique text. You can do this anywhere in your script, at any time. For example:
- Udon Graph
- UdonSharp
using UdonSharp;
using UnityEngine;
using VRC.Udon.Common;

public class JumpDetector : UdonSharpBehaviour
{
    public override void InputJump(bool value, UdonInputEventArgs args)
    {
        Debug.Log("Local player jumped!");
    }
}
Add logging messages before or after your script does something important. When your UdonBehaviour runs, look at Unity's or VRChat's log to see your log messages. This helps you identify whether your script behaves as expected, or whether your script stops running before your Debug.Log could be executed.
Understanding Udon Errors
When an UdonBehaviour runs into a major issue while running in the client, it will disable itself. If you're looking at the VRChat's logs, you'll see an entry like this:
[UdonBehaviour] An exception occurred during Udon execution, this UdonBehaviour will be halted.
To find out more about what happened, open up your log files using the instructions above under Finding Your Logs, and search for the world 'halted'. There, you will find some more information about what happened.
Example
Here's an error you might encounter in Udon. Let's take it apart:
2020.08.28 17:40:51 Error      -  [UdonBehaviour] An exception occurred during Udon execution, this UdonBehaviour will be halted.
VRC.Udon.VM.UdonVMException: An exception occurred in an UdonVM, execution will be halted. ---> VRC.Udon.VM.UdonVMException: An exception occurred during EXTERN to 'VRCSDK3VideoComponentsBaseBaseVRCVideoPlayer.__GetTime__SystemSingle'. ---> System.NullReferenceException: Object reference not set to an instance of an object.
  at VRC.SDK3.Internal.Video.Components.AVPro.AVProVideoPlayerInternal.GetTime () [0x00000] in <00000000000000000000000000000000>:0
  at VRC.Udon.Wrapper.Modules.ExternVRCSDK3VideoComponentsBaseBaseVRCVideoPlayer.__GetTime__SystemSingle (VRC.Udon.Common.Interfaces.IUdonHeap heap, System.UInt32[] parameterAddresses) [0x00000] in <00000000000000000000000000000000>:0
- The important information is in the second line.
An exception occurred during EXTERN to 'VRCSDK3VideoComponentsBaseBaseVRCVideoPlayer.__GetTime__SystemSingle'. ---> System.NullReferenceException: Object reference not set to an instance of an object.
- This error tells you that our world is trying to access something that does not exist.
- Specifically, the script was trying to access a
VRCVideoPlayerwhen it doesn't have one assigned. That's whatObject reference not set to an instance of an objectmeans, andVRCSDK3VideoComponentsBaseBaseVRCVideoPlayer.__GetTime__SystemSingletells you that it occurred when it tried to callGetTimeon aVRCVideoPlayer. - Once you get comfortable reading logs, this kind of information is invaluable.
- Specifically, the script was trying to access a
- You can now go to the graph that tries to call
VRCVideoPlayer.GetTimeand make sure it has aVRCVideoPlayerconnected to it.
Use Debug Log to Diagnose Udon
If you're ever in a situation where Udon is not doing something that you want it to do, a good way to diagnose it is to add logging.
Add the "Debug Log" node to your Udon Graph or execute Debug.Log in UdonSharp. Add unique message to help you understand your log, such as "The Rotating Cube script has finished running its Start event."
Put Debug Logs right before or after your script tries to do something important. Then when you run your UdonBehaviour, you can observe the log to see how far it's getting and whether or not it is doing what you expect.
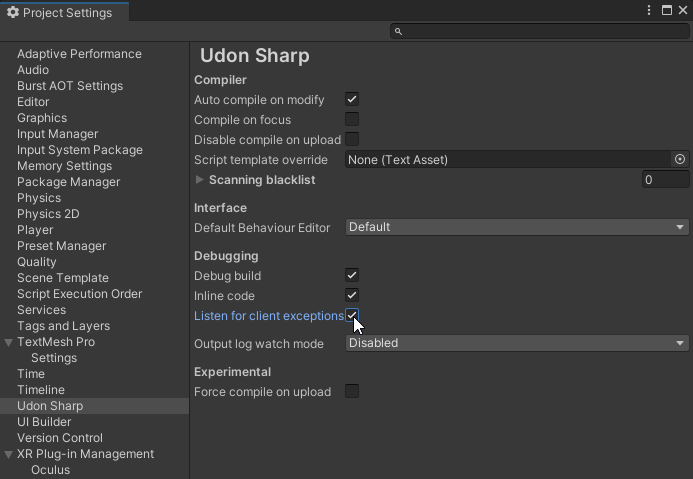
View UdonSharp Logs in Unity
UdonSharp includes a runtime exception watcher that looks for Udon exceptions from VRChat's output log. It allows you to see exactly which line in your UdonSharp script that threw an exception. This feature is enabled by default but can be disabled in your Project Settings:
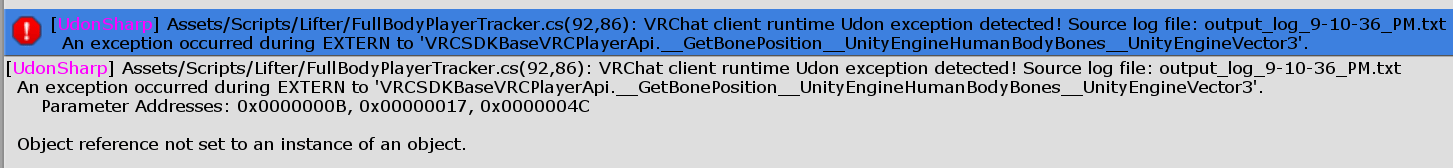
In VRChat, any errors that are thrown in your world will be shown to your editor's console. For example, in the following example, the script FullBodyPlayerTracker.cs encountered an error in line 92 at the 86th character:
Footnotes
-
On a standard English US QWERTY layout keyboard, "Backtick" is the key in the top left, next to the
1key. It shares a key with the tilde (~) character. ↩